Introducing Process Tempo's latest addition to the platform
How-to Demo: Building a Dashboard
What is the 3.7 Dashboard Builder?
Process Tempo's 3.7 Dashboard Builder is a new platform feature that allows non-technical users to quickly build dashboards without any technical knowledge or skills around data or analytics. The intuitive, no-code, drag-and-drop feature allows users to work with clean, contextual data in a secure and controlled fashion. From there, users can easily report on and share their findings.
By opening up access to data in this way, organizations can overcome traditional bottlenecks around generating valuable insight and further maximize the value of their data.

Why We Built It
We built this feature to correct problems around self-service data & analytics capabilities. Self-service initiatives haven't been as successful for organizations over recent years as anticipated. When investigating why this was the case, we found some commonalities:
Existing tools require a degree of engineering skills to be self-service. Power BI and Tableau require extensive training and are not for the casual user. These tools enable self-service access to the engineer but not the business analyst.
Self-service initiatives aren't often backed by a degree of centralized management, resulting in a profusion of reports and dashboards that lead to conflicting and overlapping versions of the truth. This complexity dramatically impacts productivity.
The presence of "defensive" data approaches locks down data access and prevents usage.
Even when data became available after navigating bureaucracy and restrictions and had been repurposed by skilled personnel into actionable data, it still took too much time and effort to translate into actionable insight for business users.
To counter these issues, we developed the ability for users to tap into an advanced yet simplistic self-service function within the platform that has successfully navigated these challenges. The result is unlimited opportunities for analysis.
Let's see it in action:
How-to Demo: Building a Dashboard
First, let’s start by creating a dashboard within our workspace. You can right-click within a folder, or click the Create button and select "Dashboard":

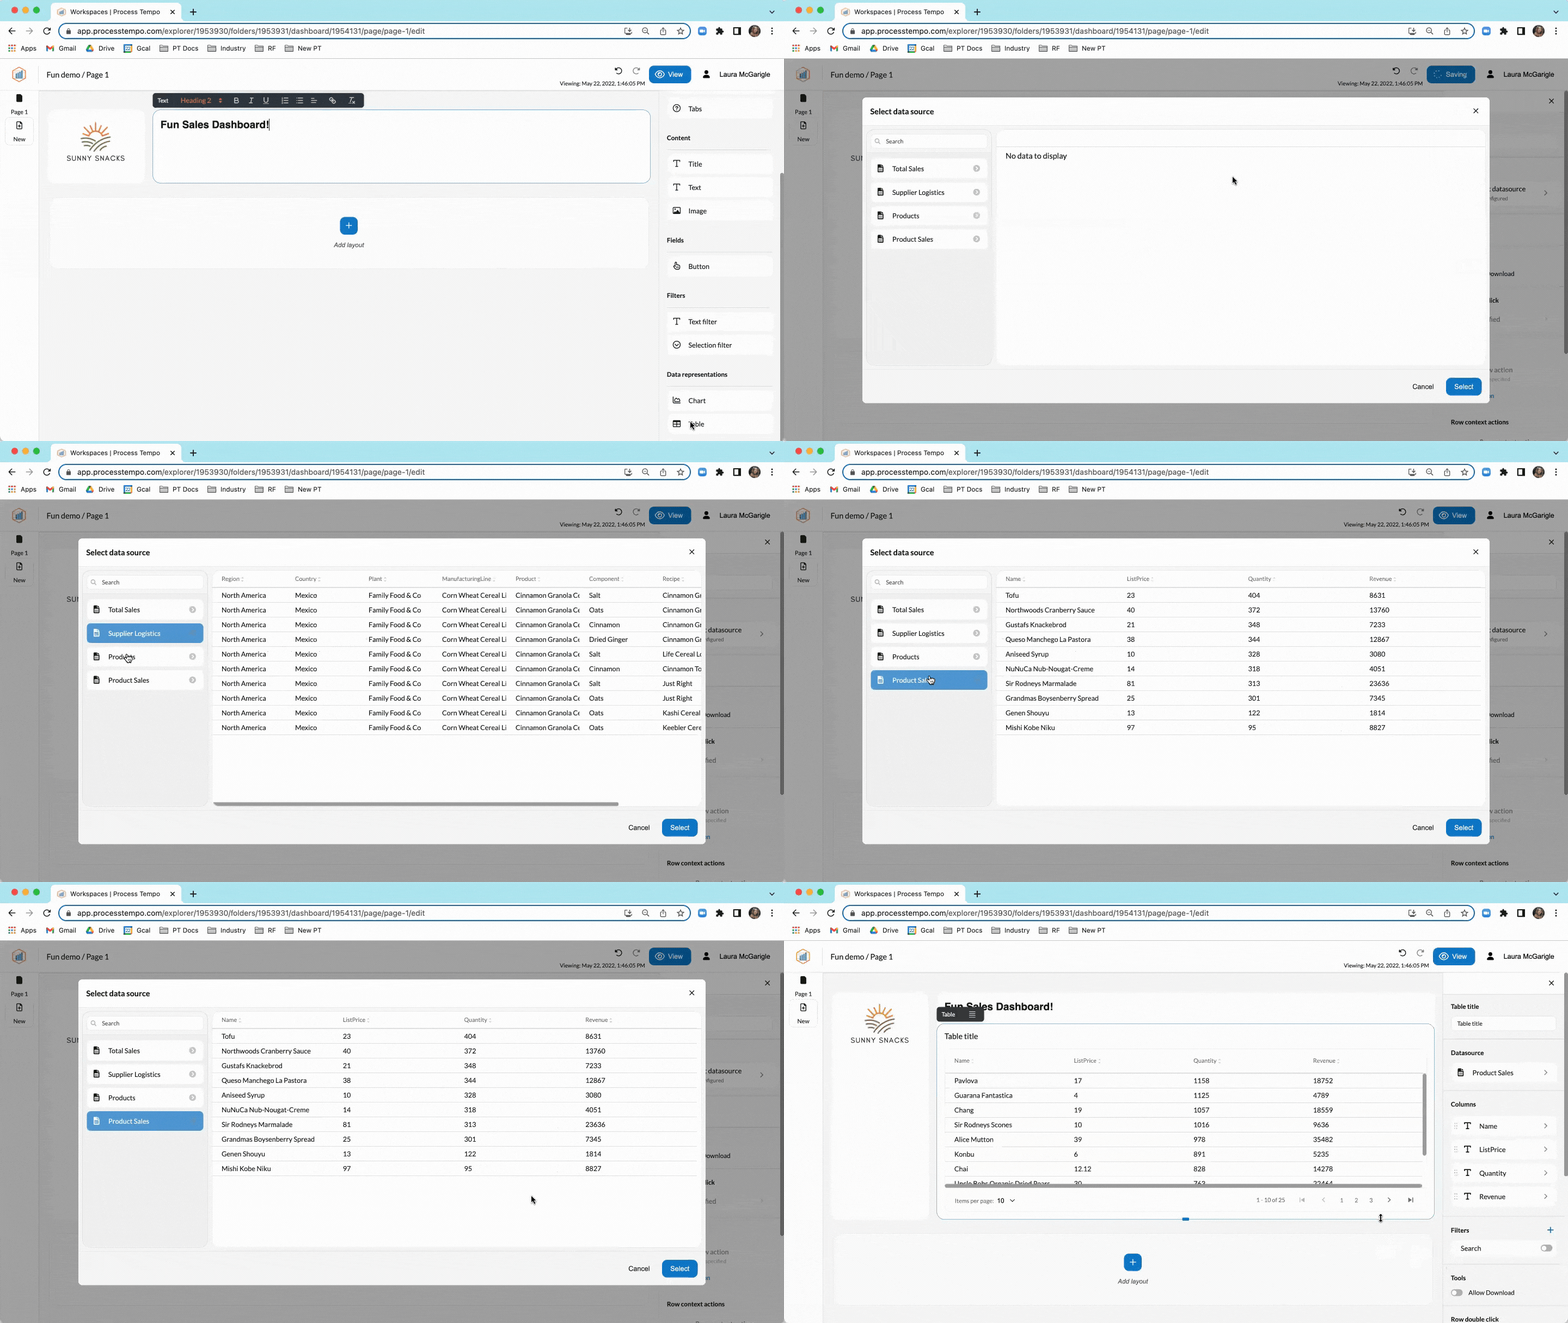
You'll see a blank canvas that you'll start with. Let’s choose the layout in which you want your dashboard to be displayed. Then, drag and drop an image, and add a title header.

Next, let’s add a table and select the report to use for analysis. Upon selecting the report, the platform automatically populates the information in the table.

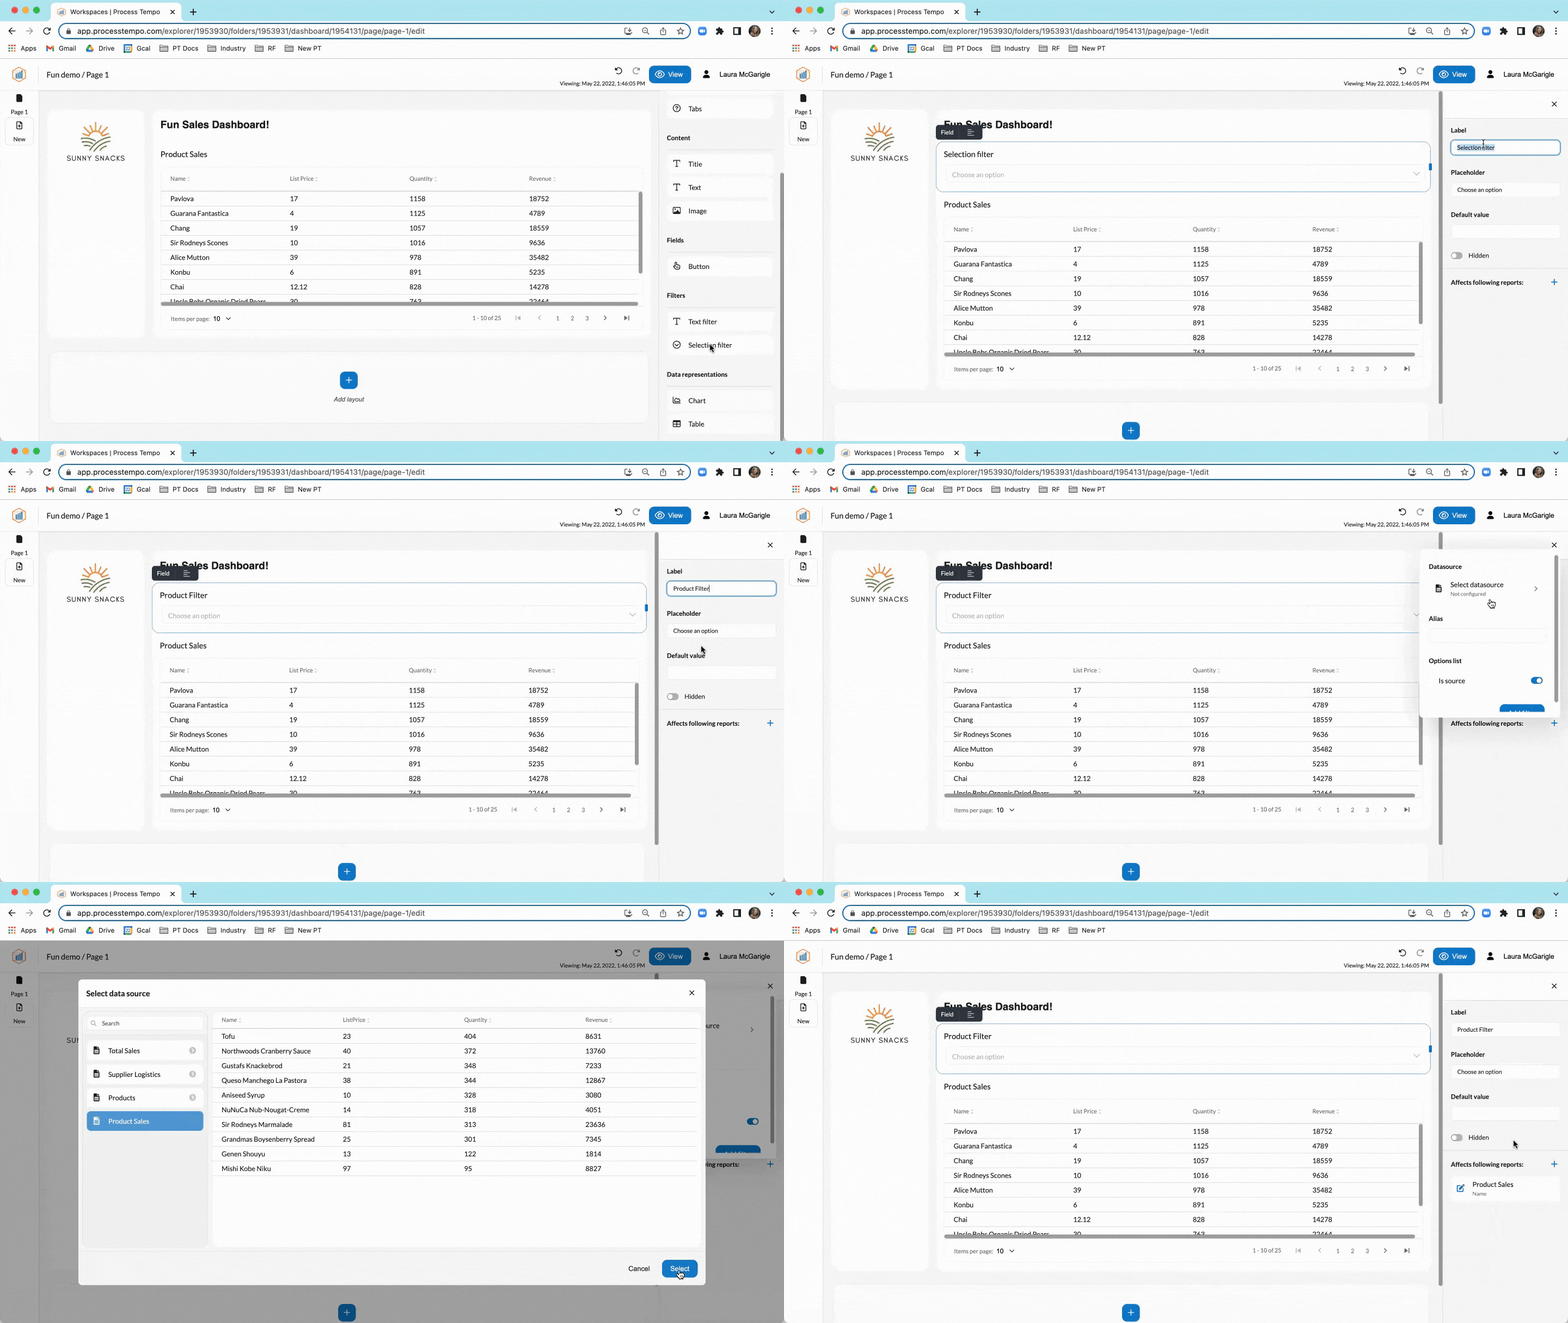
You can add a global filter to this dashboard as well. This will filter all the charts in this dashboard that have the product sales report as their source.

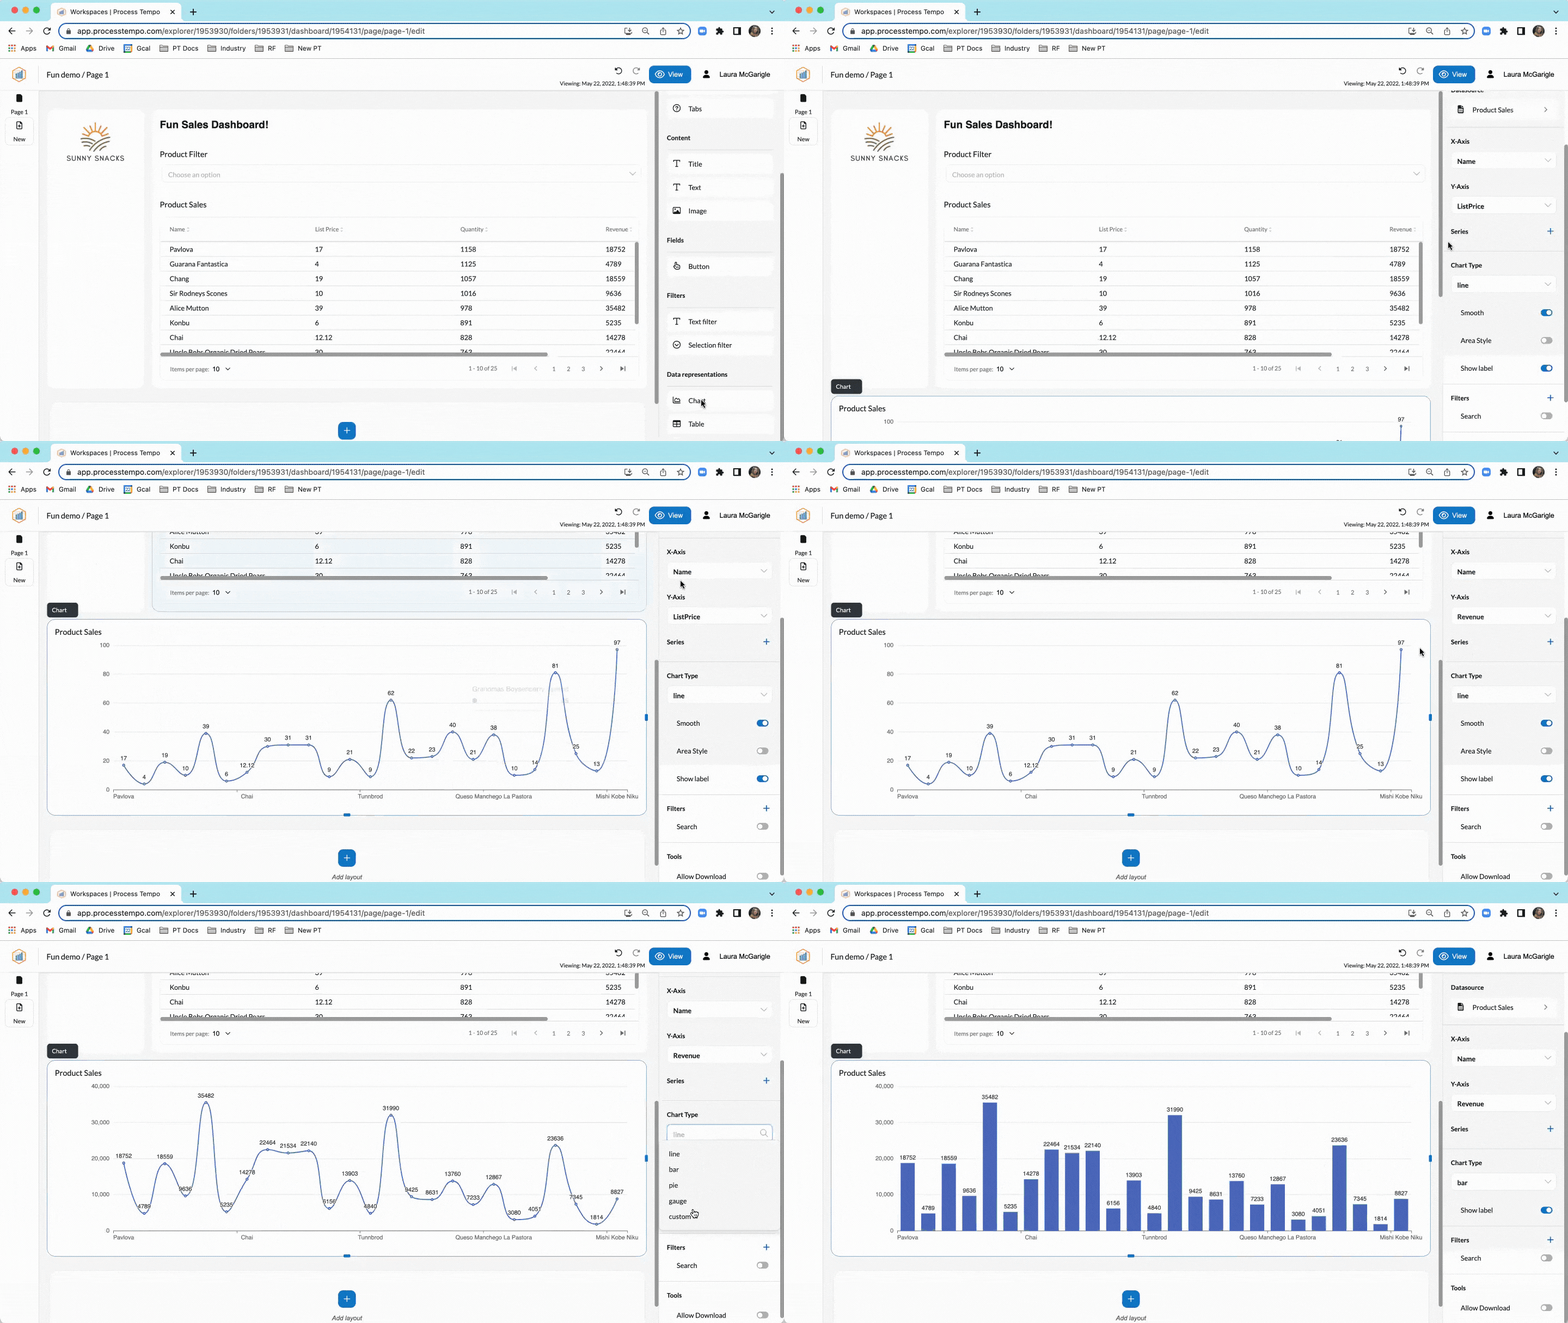
Now, let’s add a chart and use the same report as the source. The platform will automatically render a chart, and you can change the X and Y axis to my desired variables. We can also edit this chart to a bar chart.

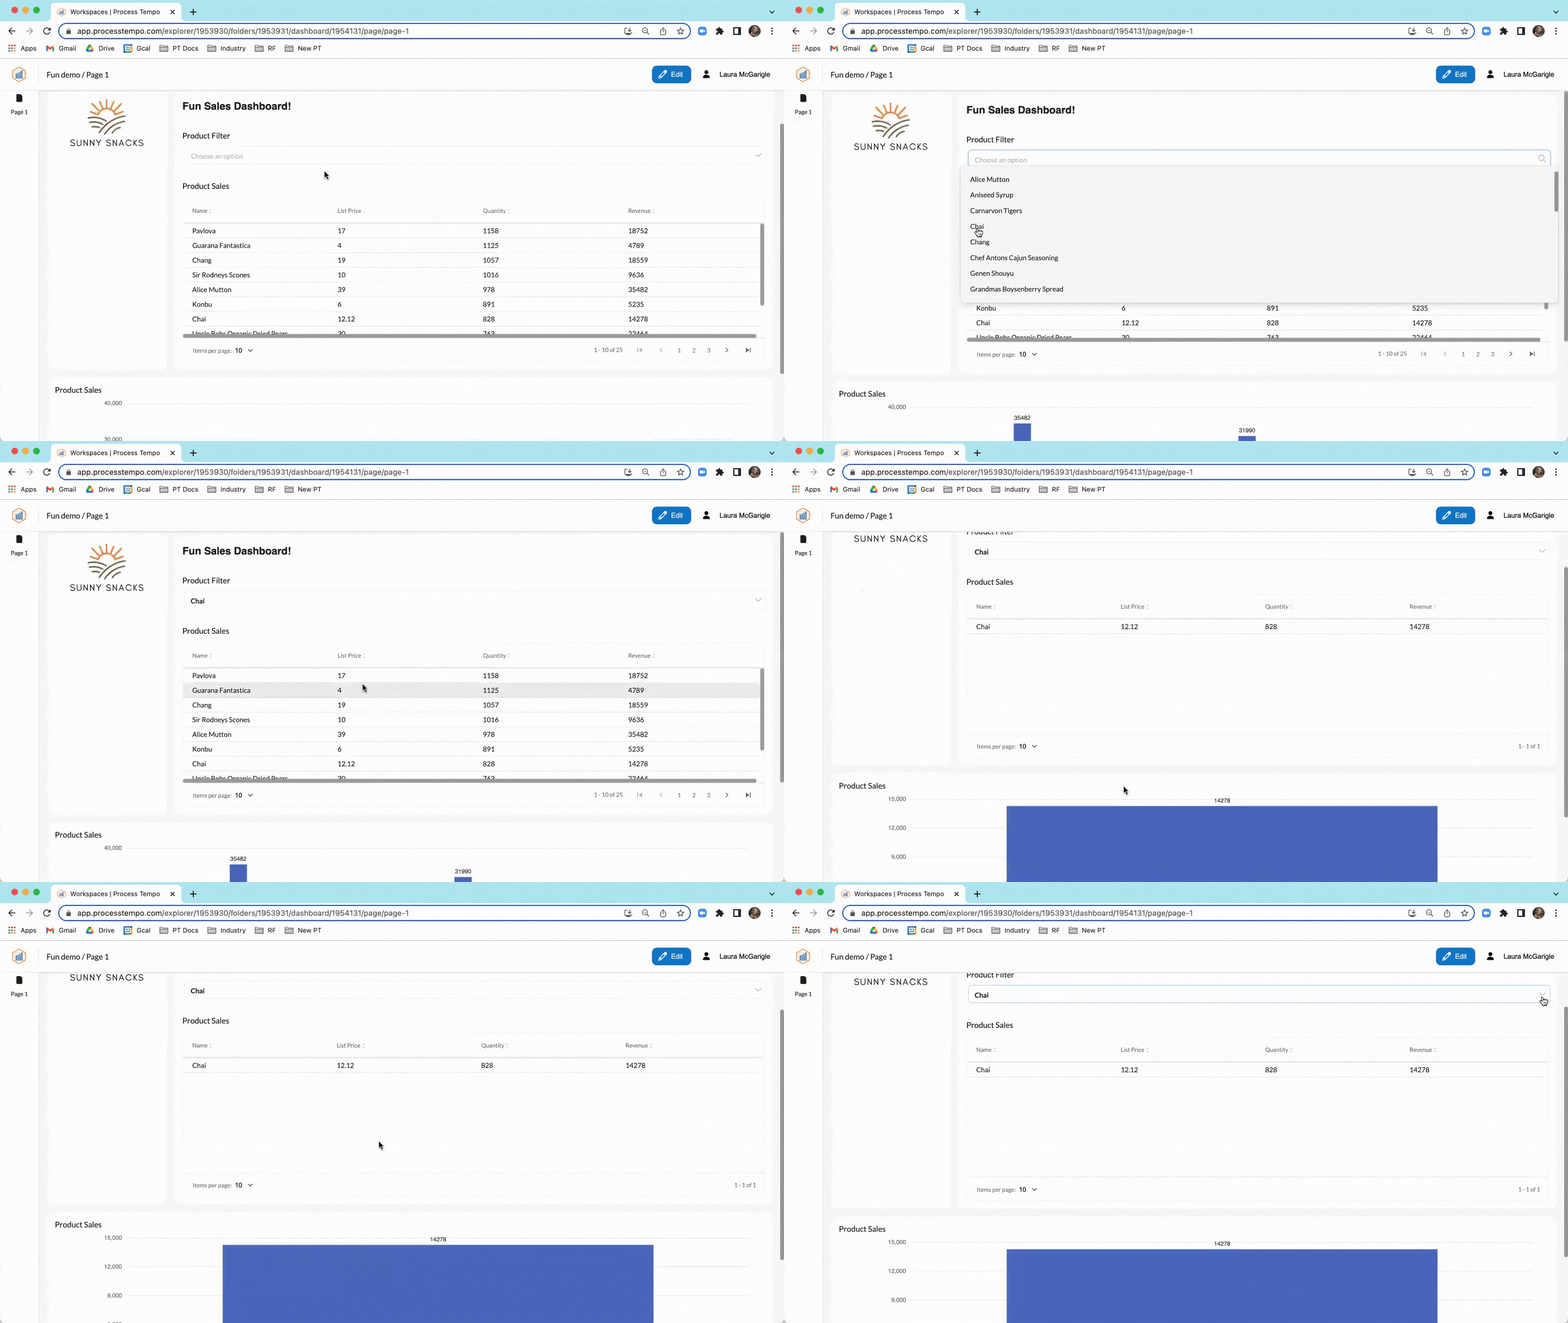
Now, you can see the global filter applied throughout the dashboard, making it incredibly easy to search and gather insights easily.

And that's how easy it is to create and populate a clean, impactful dashboard in Process Tempo's Dashboard Builder!
Why You Need It: 5 Key Reasons
Minimize complexity: Many organizations have invested heavily in tools such as Microsoft Power BI or Tableau for self-service access to data. These tools require an incredible amount of training, and the expectation cannot be to hand licenses of these tools out to analyst communities and expect great things to happen. There should certainly be no expectation for your middle manager to suddenly become a dashboard designer, data engineer, and data modeling ninja overnight. Organizations need a tool that is simple to use and easy to learn, no matter the technical aptitude of the user.
More eyes on the data = less friction in the decision making process: By facilitating access to data, it’s easier to spot data nuances when multiple stakeholders have access to the same dashboard. Each stakeholder brings their own perspective to the dashboard, and it’s important to have as many eyes on the data as possible to ensure it's effective and useful to its stakeholders. Ensuring proper governance of the dashboard is key, and all of Process Tempo’s dashboards are saved within our workspaces, which allow users to dictate who has access to what, and to which degree they can edit.
Build dashboards from a singular, unified data model: Dashboards are powered by data, and this data is ingested from multiple sources into the process tempo platform using our import modeling solution. By using a consistent data model, this forces the data to be fit to our model and the ingest process helps to detect data problems while ensuring the data is clean and properly formatted. Instead of aggregating multiple data sources with multiple formats and facing the uphill battle of inconsistencies, our unified data model creates a single version of the truth.
Eliminate dependencies on others to obtain insight: By empowering users with self service analytics at their fingertips, it frees up time for skilled individuals to focus on move-the-needle projects, while empowering business users to securely work with accurate data and present it in the format they need to tell their data stories.
Speed up the time to insight: Our dashboard builder speeds up the transition of actionable data to actionable insight. By restoring confidence into the source data and creating an easy-to-use self service platform, the time to make decisions will be significantly decreased.
The addition of our Dashboard Builder to existing Process Tempo functionalities will be transformative to how executives, department heads, individuals and teams are able to work with, manage, share, and act upon data in 2022. To learn more and to see the Dashboard Builder in action, click here to schedule a demonstration.
Process Tempo is a Decision Intelligence Data Platform built on industry-leading graph technology. The no-code, collaborative data science, data engineering, and data analytics platform simplifies complex data environments, empowering people, processes, and technologies to work together harmoniously. The secure, governed, high-performance environment delivers actionable data and insight rapidly to all stakeholders, helping to accelerate the delivery of quality, data-driven decision-making and improve business outcomes at scale. Schedule a discovery session
